2022 Maryland Soybean Fungicide Efficacy Trials
Andrew Kness, Senior Agriculture Extension Agent, University of Maryland Extension, akness@umd.edu
 JUSTIFICATION
Fungicides are becoming increasingly popular in full season soybean production. Land grant institutions across the US and in surrounding states have robust applied research programs where industry ag chemical companies submit new products and formulations for testing for the management of soybean diseases; such a project has been absent in Maryland for several years, creating a dearth in knowledge of fungicide efficacy for our soybean producers in Maryland. This project provides data that soybean producers can benefit from, such as: fungicide efficacy for managing common fungal diseases of soybean, monitor fungicide resistant pest populations, and track the economic impact of foliar fungicide applications over multiple years and environments unique to Maryland.
RESEARCH OBJECTIVES
1. Evaluate the efficacy of select foliar fungicides on full season soybeans grown on two research farms in Maryland by measuring foliar disease incidence and severity.
2. Determine any greening or green stem effects of the fungicides.
3. Monitor fungicide active ingredient efficacy over time and identify any fungicide insensitive foliar fungal pathogens.
4. Determine the yield impact of foliar fungicides and their economic impact.
METHODS
Plot Design
Field trials were established at three University of Maryland Research farms: Western Maryland Research & Education Center in Keedysville, MD (WMREC), Wye Research and Education Center in Queenstown, MD (WYE), and Central Maryland Research & Education Center (CMREC). Plots were 11’x30’ arranged in a randomize complete block design with five replicates. Planting details are outlined in Table 1. Plots were planted behind soybeans in order to create conditions conducive for developing foliar diseases on soybean.
Project supported by the Maryland Soybean Board
Table 1. Planting and harvest specifications.

Fungicide Applications
Fungicides (Table 2) were applied at the R3 growth stage (August 8 at WMREC and CMREC and August 5 at WYE) using a CO 2 powered backpack sprayer equipped with TeeJet 8003 nozzles calibrated to deliver 20 GPA at 35 psi to the center 80 inches of each plot. Treatments with R3+14 days applications were made on August 19 at WYE and August 22 at CMREC. Second applications were not made at WMREC until September 2 due to an equipment failure that required sourcing parts.
Table 2. Fungicide treatments.

Disease Rating
Foliar diseases were rated prior to fungicide application at R3 and approximately every two weeks following until approximately R6. Disease severity from frogeye leaf spot (FLS; Cercospora sojina) was visually rated as the percent leaf area infected in the upper canopy from the center four rows of each plot, as it is typically the most prevalent foliar fungal disease in Maryland soybean production.
Harvest and Statistics
Yield data were collected by harvesting the center 5 feet of each plot using an Almaco R1 research combine. All yields reported are adjusted to 13% moisture. Harvest dates are shown in Table 1. Statisticsrelated to profitability and economics were calculated using the cash market price for soybean of $14.60 per bushel at the time of analysis. Data were analyzed using ANOVA and significant differences between treatments were separated using Fisher’s Least Significant Difference (LSD; α=0.10).
RESULTS & DISCUSSION
Disease Rating
Growing conditions were generally very favorable and we did not observe any ratable fungal diseases at any of the three trial locations. This is likely due to the weather conditions around pod fill, as well as the resistance package in the soybean variety; Mid-Atlantic Seed ‘3521E3’ has a frogeye leafspot resistance rating of 7 on a 10-point scale (10 being the most resistant). Furthermore, due to a wet spring, plots had delayed planting by about 2-3 weeks. This delay in planting results in slower canopy closure, which promotes air movement between rows and thus reduces leaf wetness, likely contributing to reduced foliar disease pressure.
Yield
Yields (Figure 1 and Table 2) were above average at WMREC, with a trial average of 84.7 bushels per acre. Yields at CMREC were about average and yields at WYE were at or just below average, with 67.0 and 60.2 bushels per acre, respectively. Statistically, there were no significant differences between fungicide treatments and the non-treated control at any of the trial locations (P=0.6583 at WMREC, P=0.7095 at CMREC, and P=0.3133 at WYE). There were also no significant differences in grain moisture or test weight.


Figure 1. Soybean grain yield. Each error bar is constructed using 1 standard error from the mean. No significant differences between treatments at each location (α=0.10).
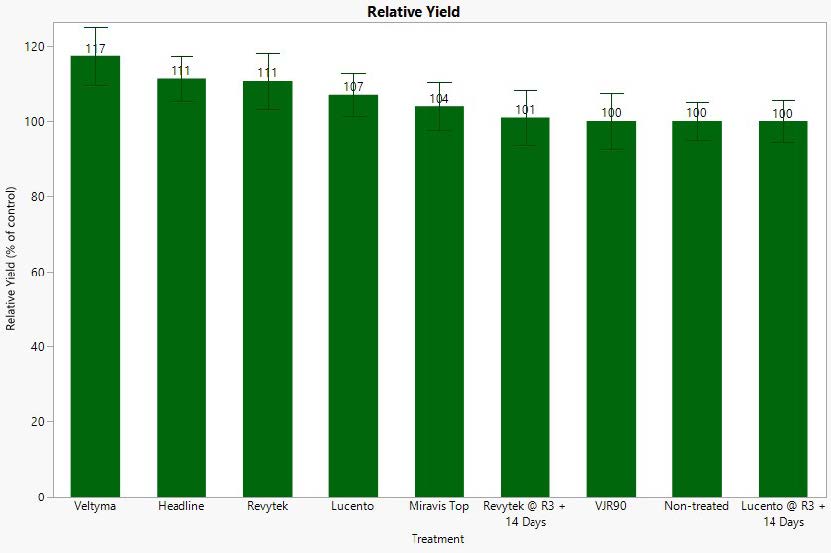
Since there was a significant difference in yield between locations (P<0.0001), relative yield was calculated and used as a way to compare yields across locations. Relative yield was calculated by dividing the plot yield by the non-treated control plot yield and reported as a percent. When data were combined this way, no significant differences were observed between treatments (P=0.4285, Figure 2).
CONCLUSIONS, IMPLICATIONS, AND FUTURE WORK
In previous years of this study, foliar fungicide applications with the selected products tested here provided some benefit related to improved seed quality and yield in situations where FLS disease pressure was present at measurable levels. Fungicides also significantly increased plant greenness and delayed senescence.
During the 2022 growing season, however, none of the treatments tested yielded significantly different than the non-treated control. This is likely due to the fact that no ratable foliar fungal diseases were present in the plots this year. Without the presence of a pathogen, fungicides have reduced odds of improving yields over non-treated plots.

Figure 2. Relative grain yield of all site locations combined. Each error bar is constructed using 1 standard error from the mean. No significant differences between treatments (α=0.10).
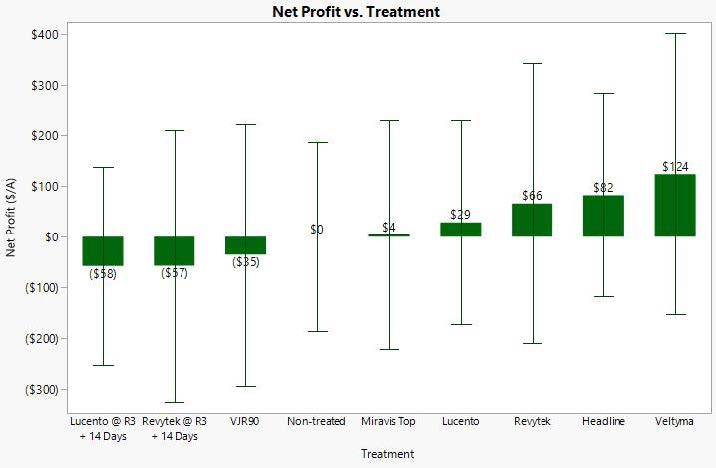
Relative net profit was calculated by multiplying the bushel increase over the non-treated control by the cash market price for soybean at the time of analysis (14.60/bu for 2022) and subtracting the cost of application. A flat rate of $26.00 per acre was used for 2022 data; for plot with two applications, $52 was used. This metric, net profit, was used to compare the economics of the fungicides while accounting for yield and market prices.
Figure 3 shows net profit for each treatment; there are no significant differences (P=0.2997).
Figure 3. Net profit of 2023 fungicide treatments. Each error bar is constructed using 1 standard deviation from the mean. No significant differences between treatments (α=0.10).
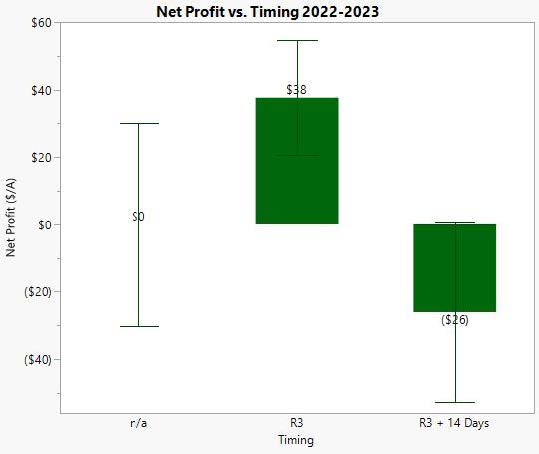
When net profit was analyzed by treatment timing (R3, R3 + 14, and none) across all years (2022-2023), the single R3 application was provided a significantly greater profit margin ($38/acre) than two reatment program (-$26/acre) and the non-treated control (P=0.0878; Figure 4). These data indicate that a single fungicide application at R3 provides the greatest yield increase and profit margin compared to a two-pass program.

Figure 4. Net profit by fungicide timing of 2022-2023 treatments combined. Each error bar is constructed using 1 standard error from the mean. Treatment timings connected by the same letter are not significantly different (α=0.10).
Future work will be focused on replicating similar experiments over more plot-years to gather more data for Maryland’s unique growing conditions and to track pathogen resistance and fungicide profitability over time.
ACKNOWLEDGEMENTS
This work is supported by grant funding through the Maryland Soybean Board and in-kind support from, BASF, FMC, and Syngenta. Special thanks to the Maryland Agriculture Experiment Station and research farm crew at the Western Maryland Research & Education Center, Central Maryland Research & Education Center, and the Wye Research and Education Center for making this research possible.
APPENDIX
Precipitation WMREC

Precipitation CMREC

Precipitation WYE
