2019 ‘Buckeye Gala’ NC-140 Apple Rootstock Trial
Macarena Farcuh, Assistant Professor, Plant Science & Landscape Architecture
mfarcuh@umd.edu - https://www.facebook.com/FruitQualityLab
This NC-140 replicated trial was planted in Spring 2019. During the first growing season trees were set, trellises were built, and trees were trained to the tall spindle system as specified in the protocol. In year 2020 through 2022, we have almost 100% tree survival in this planting, except for one Gala tree grafted on G.935 rootstock that did not survive (thus in this rootstock we have 93.3% survival; Table 1). Trees continued
growing well and we obtained a third crop this year.
From our data collected in 2022, and in agreement with what we observed from 2019 through 2021, we can observe that Buckeye Gala on G.969 displayed the significantly highest spring trunk circumference values, while Buckeye Gala on G.41 and G.11 presented the significantly lowest, for all three years (Table 1).
Regarding root suckers, it is important to highlight that the number of these has increased throughout the years for all rootstocks, with the exception of G.11 which has always shown zero presence of roots suckers. In 2021, root suckers were highest for Gala fruit grafted on G.4814, and which statistically differed from M.26, NZ.2, M.9T337 and G.41, and of course G.11 (Table 1).
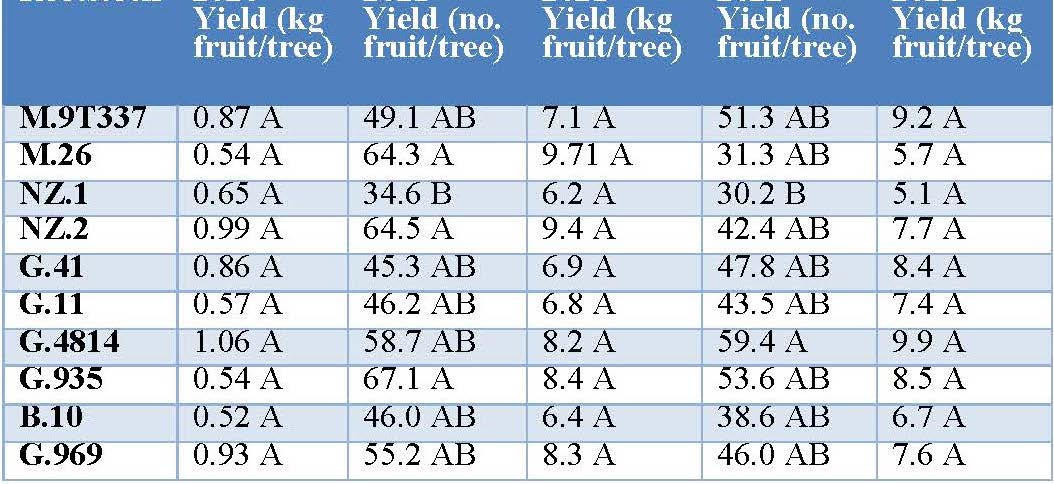
With respect to yield, we evaluated the kg of fruit per tree as well as the number of fruit per each tree. It is important to mention that we got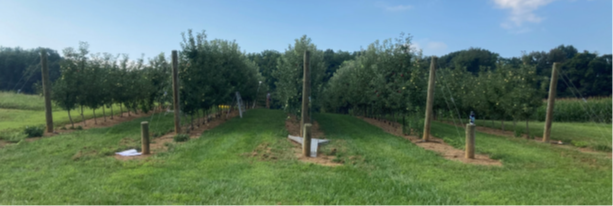 hit by frosts events during the 2022 spring and that affected the crop load of our trees, in addition to thinning. In terms of number of fruit per tree, for 2021, we observed that Gala grafted on G.935, NZ.2 and M.26 obtained the highest values, while, Gala on NZ.1 displayed the lowest yield values (Table 2). In the case of 2022 evaluations, Gala grafted on G.4814, displayed the highest number of fruit per tree, followed by G.935, while consistently NZ.1 displayed the lowest numbers of fruit
 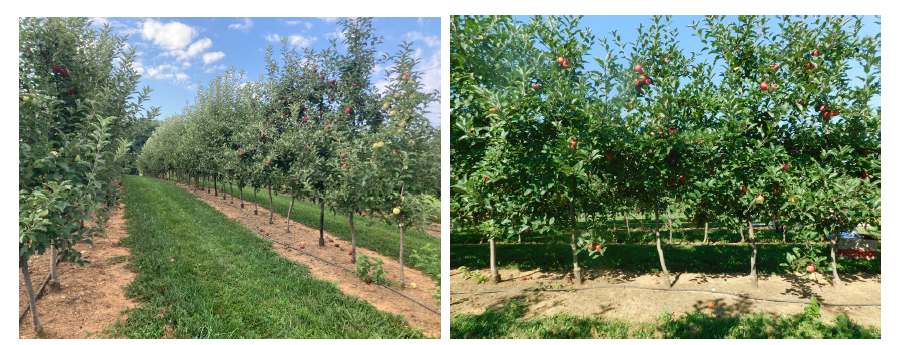 per tree as the previous year. Regarding yield in terms of kg of fruit per tree, although there seem to be no statistic differences among the 10 evaluated rootstocks in 2020 through 2022, the tendencies are similar to what observed for yield in terms of number of fruit per tree for each year. G.935 appears as consistently displaying the highest yields among the different rootstocks analyzed throughout the three consecutive years (Table 2). Finally, it is important to mention that we did see an increase in independent fruit weight throughout the years 2021 and 2022, with an average increase between 30-50g per fruit.
Table 1. 2019 ‘Buckeye Gala’ NC-140 Apple Rootstock Trial in Keedysville, Maryland. Fall trunk circumference and number of root suckers (2019-2021) data.

Table 2. 2019 ‘Buckeye Gala’ NC-140 Apple Rootstock Trial in Keedysville, Maryland. Yield data (number of fruit/ tree and kg of fruit/tree) assessed from 2020-2022.
Mean separation within columns by Tuckey’s HSD (P<0.05).