Field Evaluation of the Efficiency of DDI Concentrate for Weed Control and Residual Activity
Galen P. Dively - Department of Entomology, University of Maryland, Josh Matta - i2LResearch USA, Inc.
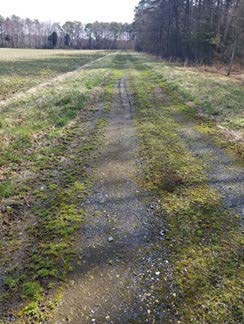
An experimental field trial was conducted in 2022 at the Central Maryland Research and Education Center, Beltsville facility, to evaluate the efficacy of an experimental herbicide (DDI) for immediate burndown and residual weed control. Treatment plots were established along a 200 m farm lane with a mixture of weeds growing between the wheel tracks on a gravel+soil substrate and compared directly next to the lane with weeds growing on a soil substrate (Fig. 1). Four replicate blocks of plots were laid out along the farm lane at selected sites with similar sunlight exposure and weed composition. Each block consisted of five plots in the gravel+soil substrate, paired directly with five plots on one side of the lane in the soil substrate (Fig. 2). Each plot measured 1 m x 2 m.
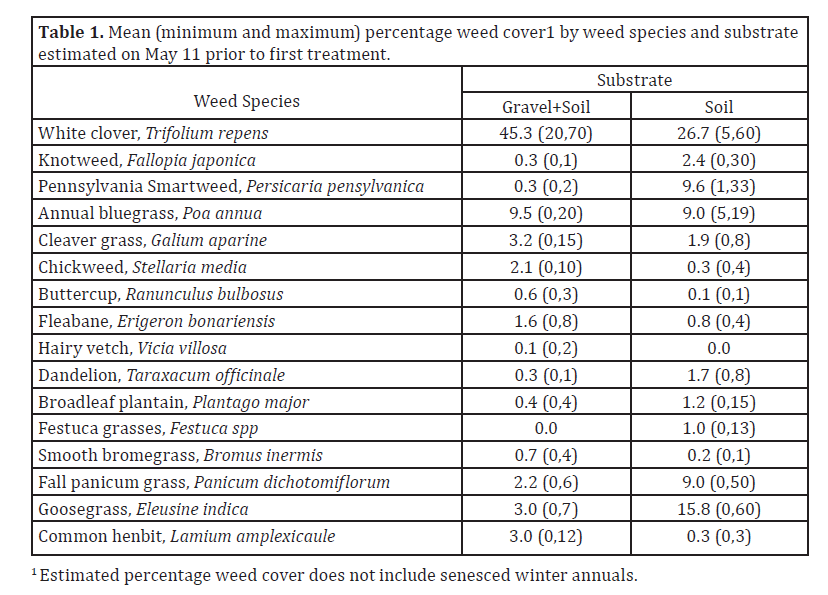
Pretreatment counts of weed cover by weed type were recorded in each plot on May 23, when most active growing weeds were less than 5 cm and winter annuals were beginning to yellow and die. Weed cover was visually estimated as the percent of surface area covered by weed vegetation; however, the proportion of ground covered by senesced winter annuals was not included. Results of the pretreatment abundance of weeds are given in Table 1. Overall weed cover averaged 54.5 and 61.0% in the gravel+soil and soil substrates, respectively. Only a very low percentage of the weeds present were summer species that were just beginning to germinate and thus difficult to identify. The dominant species present prior to treatment included white clover, annual bluegrass, and goose grass.
Pretreatment counts of weed cover by weed type were recorded in each plot on May 23, when most active growing weeds were less than 5 cm and winter annuals were beginning to yellow and die. Weed cover was visually estimated as the percent of surface area covered by weed vegetation; however, the proportion of ground covered by senesced winter annuals was not included. Results of the pretreatment abundance of weeds are given in Table 1. Overall weed cover averaged 54.5 and 61.0% in the gravel+soil and soil substrates, respectively. Only a very low percentage of the weeds present were summer species that were just beginning to germinate and thus difficult to identify. The dominant species present prior to treatment included white clover, annual bluegrass, and goose grass.
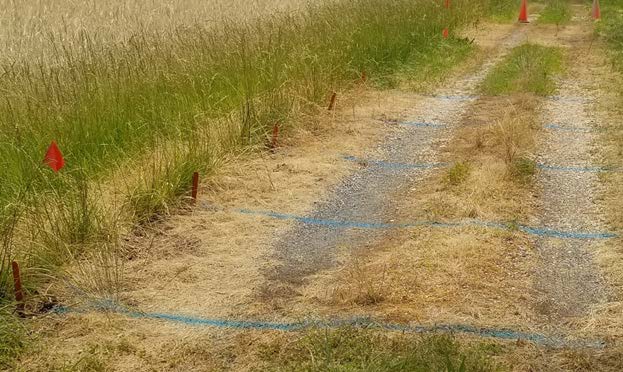
Treatments were assigned to the plots in both substrates as follows: 1) a single application of Ortho GC RTU applied at the rate of 1 gallon per 300 ft.²; 2) two applications of Ortho GC RTU applied at the rate of 1 gallon per 300 ft.²; 3) a single application of DDI applied at the rate of 1 gallon per 500 ft.²; 4) two applications of DDI applied at the rate of 1 gallon per 500 ft.²; and 5) untreated control. Each treatment in both substrates was arranged side-by-side in each block as a split plot design (Fig. 2). The first application was applied on May 31 (Day 0), using a backpack CO2 sprayer with a three-nozzle boom delivering specified rates of gallons per 300 or 500 ft.² at 40 psi. The speed of the boom over the 2 m length of each plot differed by treatment and was timed in seconds with a stop watch. The second application of treatments #2 and #4 was applied on August 23 (Day 84), using the same methods.
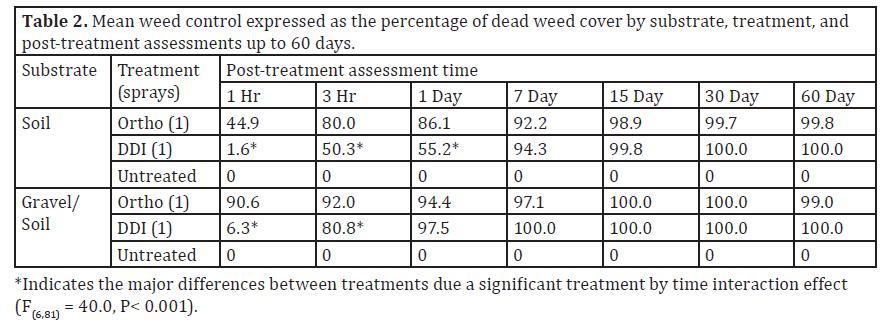
During the 60 days following the first treatment, the initial burndown effects were recorded by visually estimating the percentage of dead weed cover, relative to the plot area covered with weeds. Data were recorded at 1, 3 and 24 hours after the first application on May 31. Thereafter, additional assessments of percent dead cover were made on June 7 (7 days PT), June 20 (15 days PT), July 3 (30 days PT), and August 3 (60 days PT). Means of percent dead weed cover are given in Table 2. A factorial analysis of variance procedure was performed on the averaged data of each pair of Ortho and DDI treated plots, excluding data from the untreated control plots. The arsin function was used to transform and normalize the data before analysis. The single application of both herbicides provided significantly better overall weed control (F(1,81) = 81.0, P< 0.001) in the gravel/soil plots (89.8%; SE=3.31) compared to weed control in the soil plots (78.8%; SE=4.00). The gravel/soil plots contained mainly smaller broadleaf weeds and less hard-to-kill grass species. As evident by a significant treatment by time interaction effect (F(6,81) = 40.0, P< 0.001), the initial burndown effect of the Ortho treatment was significantly greater than the DDI treatment, but differences between treatments decreased after 7 days PT. Pooled over assessment times, dead weed cover averaged 85.9% and 71.6% in the soil substrate, compared to 96.2% and 83.5% in the soil substrate for the Ortho and DDI treatments, respectively. However, this substrate by treatment interaction was not statistically significant (P = 0.31).
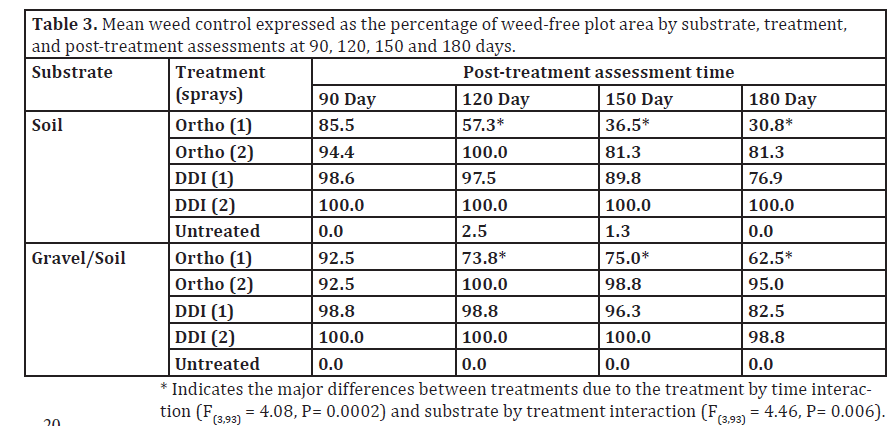
After the second application of both herbicides on August 23 (Day 84), assessments recorded as a percentage of weed-free plot area were made on August 31 (90 days PT), September 30 (120 days PT), November 3 (150 days PT) and December 2 (180 days PT) to evaluate the residual activity of the treatments. The results showing differences in residual actively are given in Table 3. An analysis of variance was performed on the transformed data, excluding the data from the untreated control plots. Significant effects were revealed by the treatment by time interaction (F(3,93) = 4.08, P= 0.0002) and substrate by treatment interaction (F(3,93) = 4.46, P= 0.006). Overall, percent weed-free differences among treatments steadily increased over time, indicating that the single application of DDI provided significantly better residual activity compared to the single Ortho treatment, particularly in the soil substrate plots. Additionally, the second application of DDI provided relatively less of an increase in weed control compared to the second application of the Ortho herbicide.
Although both herbicides had a significant impact on all weed species, the gravel/soil plots developed a dense mat of moss over more than 80% of the plot area during the fall, indicating that both treatments had no residual activity against this non-vascular plant.